Web vitals
Web Vitals are metrics created by Google to measure the user expierence of websites.
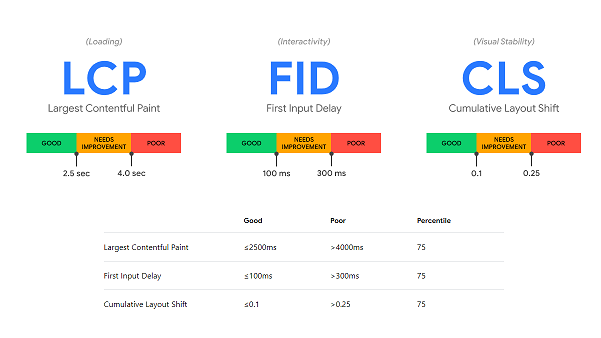
The 'Core Web Vitals' (CWV) are a subset, a set where Google focusses on and where you should focus on. For now (2020 2021) Google has included the LCP, FID and CLS in the Core Web Vitals. They measure the: 'loading', 'interactivity' and 'visual stability' of pages.
The 'Core Web Vitals' (CWV) are a subset, a set where Google focusses on and where you should focus on. For now (2020 2021) Google has included the LCP, FID and CLS in the Core Web Vitals. They measure the: 'loading', 'interactivity' and 'visual stability' of pages.
Largest Contentful Paint(LCP)
The time to load and show the biggest element above the fold, LCP measures 'loading performance'. Has influence on the perceived loading expierence for the page. For a good user expierence this has to be under 2.5 seconds.
First Input Delay(FID)
How fast the page is interactive and can be used by visitors. The FID metric is calculated and based on actual field data, a proxy for FID is the 'Total Blocking Time'.
'TBT' measures all the individual 'long tasks'. All tasks over 50 miliseconds are considered long. The sum of excess time above 50ms is the TBT.
Cumulative Layout Shift(CLS)
The visual stability of the page. Shifting elements cause frustration. Imagine reading text which suddenly moves, not pleasent.
Or wanting to click a link which suddenly moves and you end up clicking something else.
Core Web Vitals - Metrics and thresholds
Ranges for Core Web Vitals. When a metric is poor and needs work. Or is 'good'.
Why important?
Google started using the 'Page experience' metrics as ranking factor. During the summer of 2021 the update will be rolled out.
Offcourse you don't know how much of a ranking factor it is and will be. Just like all the other factors it is a mystery ;-).
Good quality content and links to your pages are probably more important but who knows what will matter in the future.
Other Web Vitals:
Serve as proxy or supplemental metrics for the Core Web Vitals.
- First Contentful Paint(FCP):
Measuring perceived load speed. Time between navigation to page to when a user sees something.
- Speed Index (SI):
How fast content is visually presented on the page, based on the 'visual progression' of the painting of frames during page load.
- Time to Interactive(TTI):
Is at the end of the last long task. Long task is longer than 50ms. If no long tasks, than TTI ends at end of FCP. - Time to First Byte(TTFB):
Slow server. She time that it takes for a user's browser to receive the first byte of page content.
Score
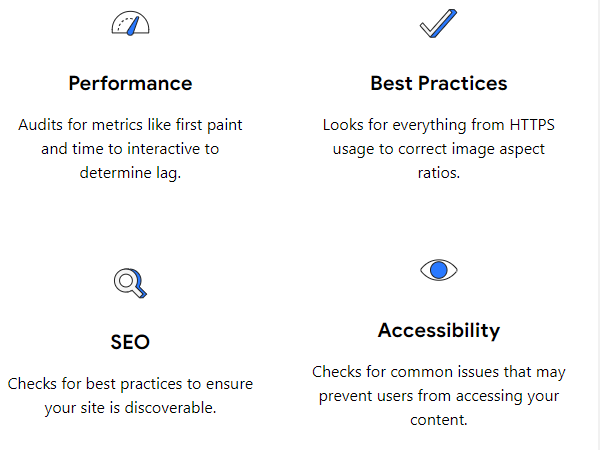
There are four categories of metrics. In every category the maximum score is 100 points. So a total of 400 is maximum score.
About this benchmark
The calculations are made from US based servers. Github / Microsoft Cloud to be exact. I think they are located in the US, but don't know for sure.
Every category is updated once a week, at approximately 14.15 UTC (16:15 CET) and deployed at 16.00 UTC (18:00 CET).
Calculations are made through an emulated mobile phone on a 4x simulated slowed down internet connection.
When trying to reproduce the Lighthouse score use an incognito browser. Differences between your local scan and this website might occur. Don't treat every metrics as a hard fact. Look at trend lines and see where the trend is going. Also use it to compare to other urls.
The only goal of this website is to offer basic insights and to get you interested in website performance.